← Back to projects
Multimodal Biomarker Development
Linking neurotransmitter architecture to functional connectivity
Integrating simultaneous EEG–fMRI connectivity with PET receptor and transporter maps to investigate the pharmacological effects of ketamine and midazolam.
Technical Layer
Tools & Methods
- MATLAB
- Simultaneous EEG–fMRI
- PET receptor maps
- Functional connectivity
- EEG spectral power
- Spatial null models
- Linear mixed models
- Pharmacological neuroimaging
My role
During a PhD rotation in the Biomarker Development Group at INM-7, Forschungszentrum Jülich, I implemented a MATLAB analysis pipeline for a focused pharmacological case study. I transformed simultaneous EEG and resting-state fMRI data into region-by-region functional-connectivity matrices, integrated these matrices with normative PET receptor and transporter maps, generated receptor-informed connectivity profiles across spatial quantiles, implemented randomized-map comparisons, and prepared the resulting data for pre–post and between-condition statistical analysis. This subproject contributed to the wider collaborative work that was later formalized as the NEOFC framework.
The scientific question
Conventional functional-connectivity analysis tells us which brain regions fluctuate together, but it does not directly explain the molecular architecture beneath those relationships. My subproject asked whether PET-derived maps of neurotransmitter receptors and transporters could act as molecular filters for the functional connectome, and whether these receptor-informed patterns changed after pharmacological intervention.
The pharmacological case study
The dataset included 30 physically and psychologically healthy male participants in a three-way crossover design involving ketamine, midazolam, and placebo. Simultaneous EEG and resting-state fMRI were available before and during drug administration, allowing connectivity to be compared within individuals across pharmacologically distinct brain states.
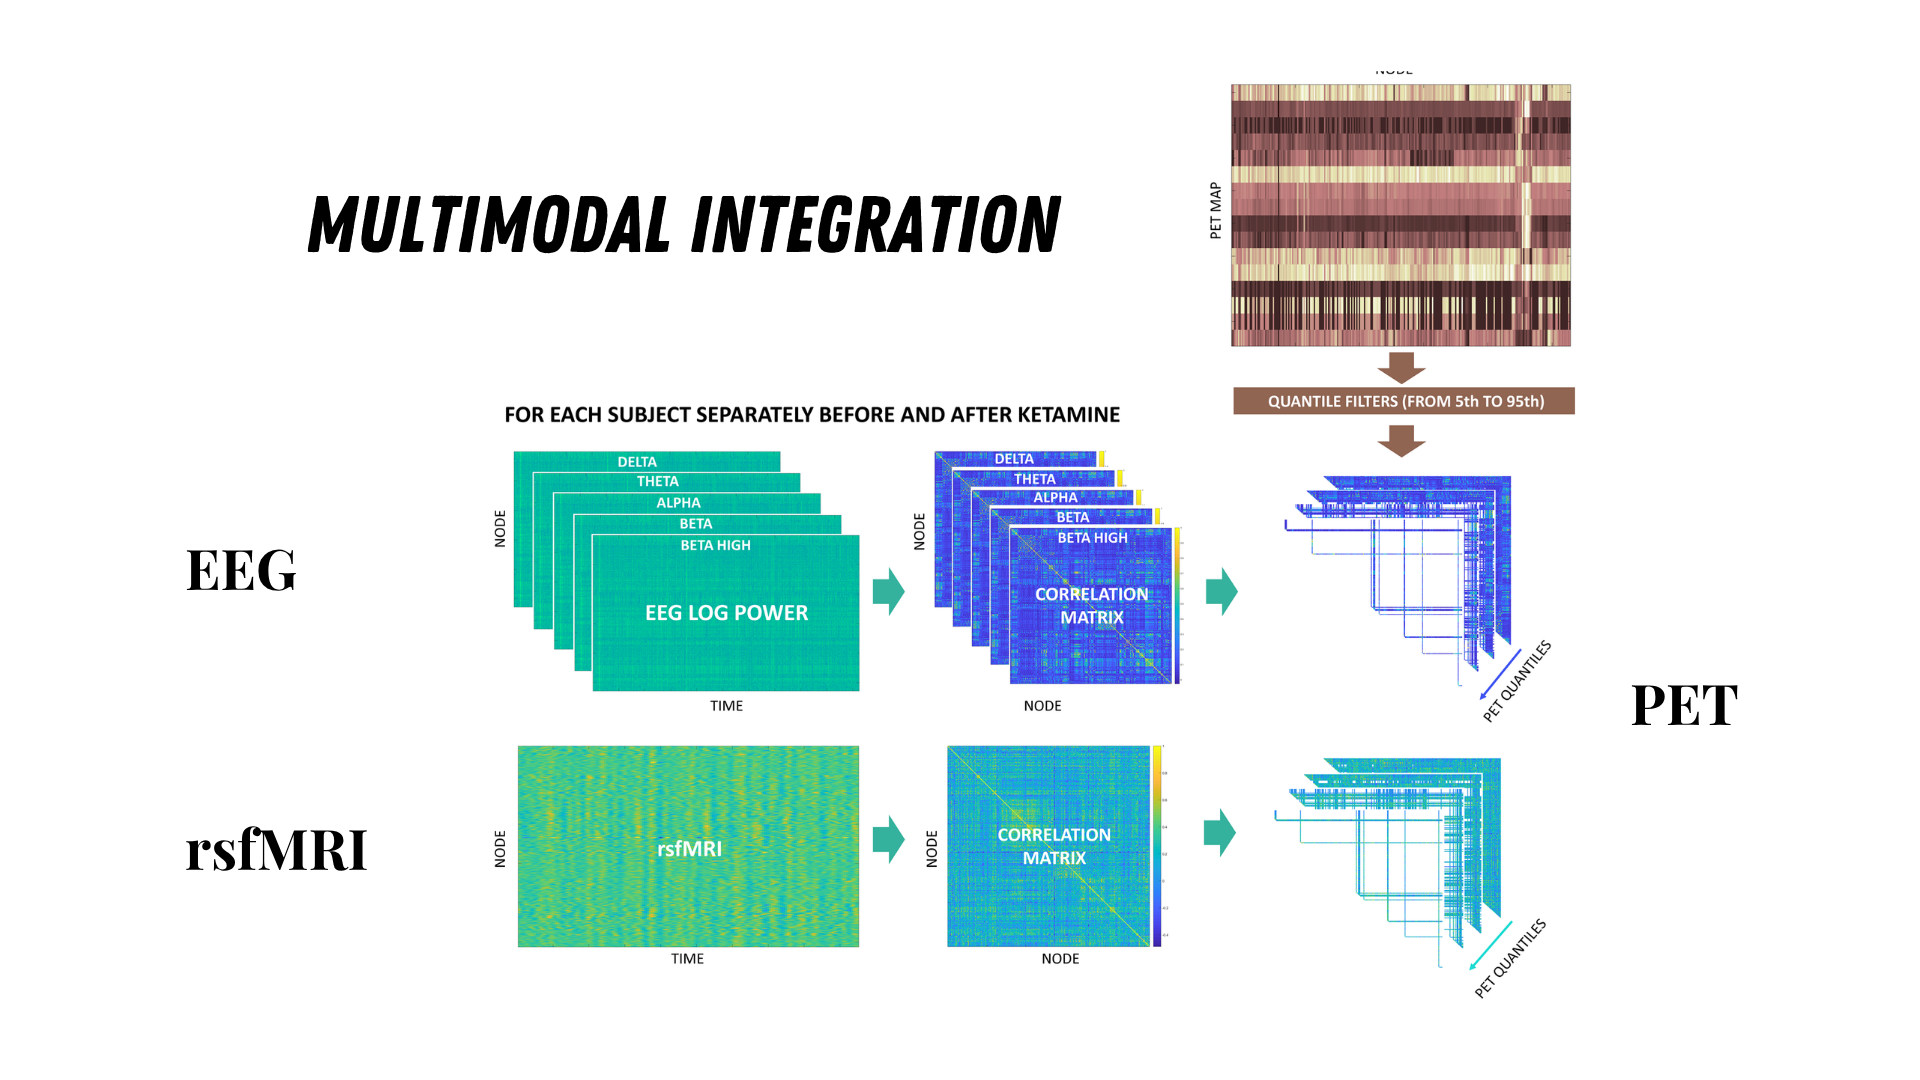
A common representation across EEG and fMRI
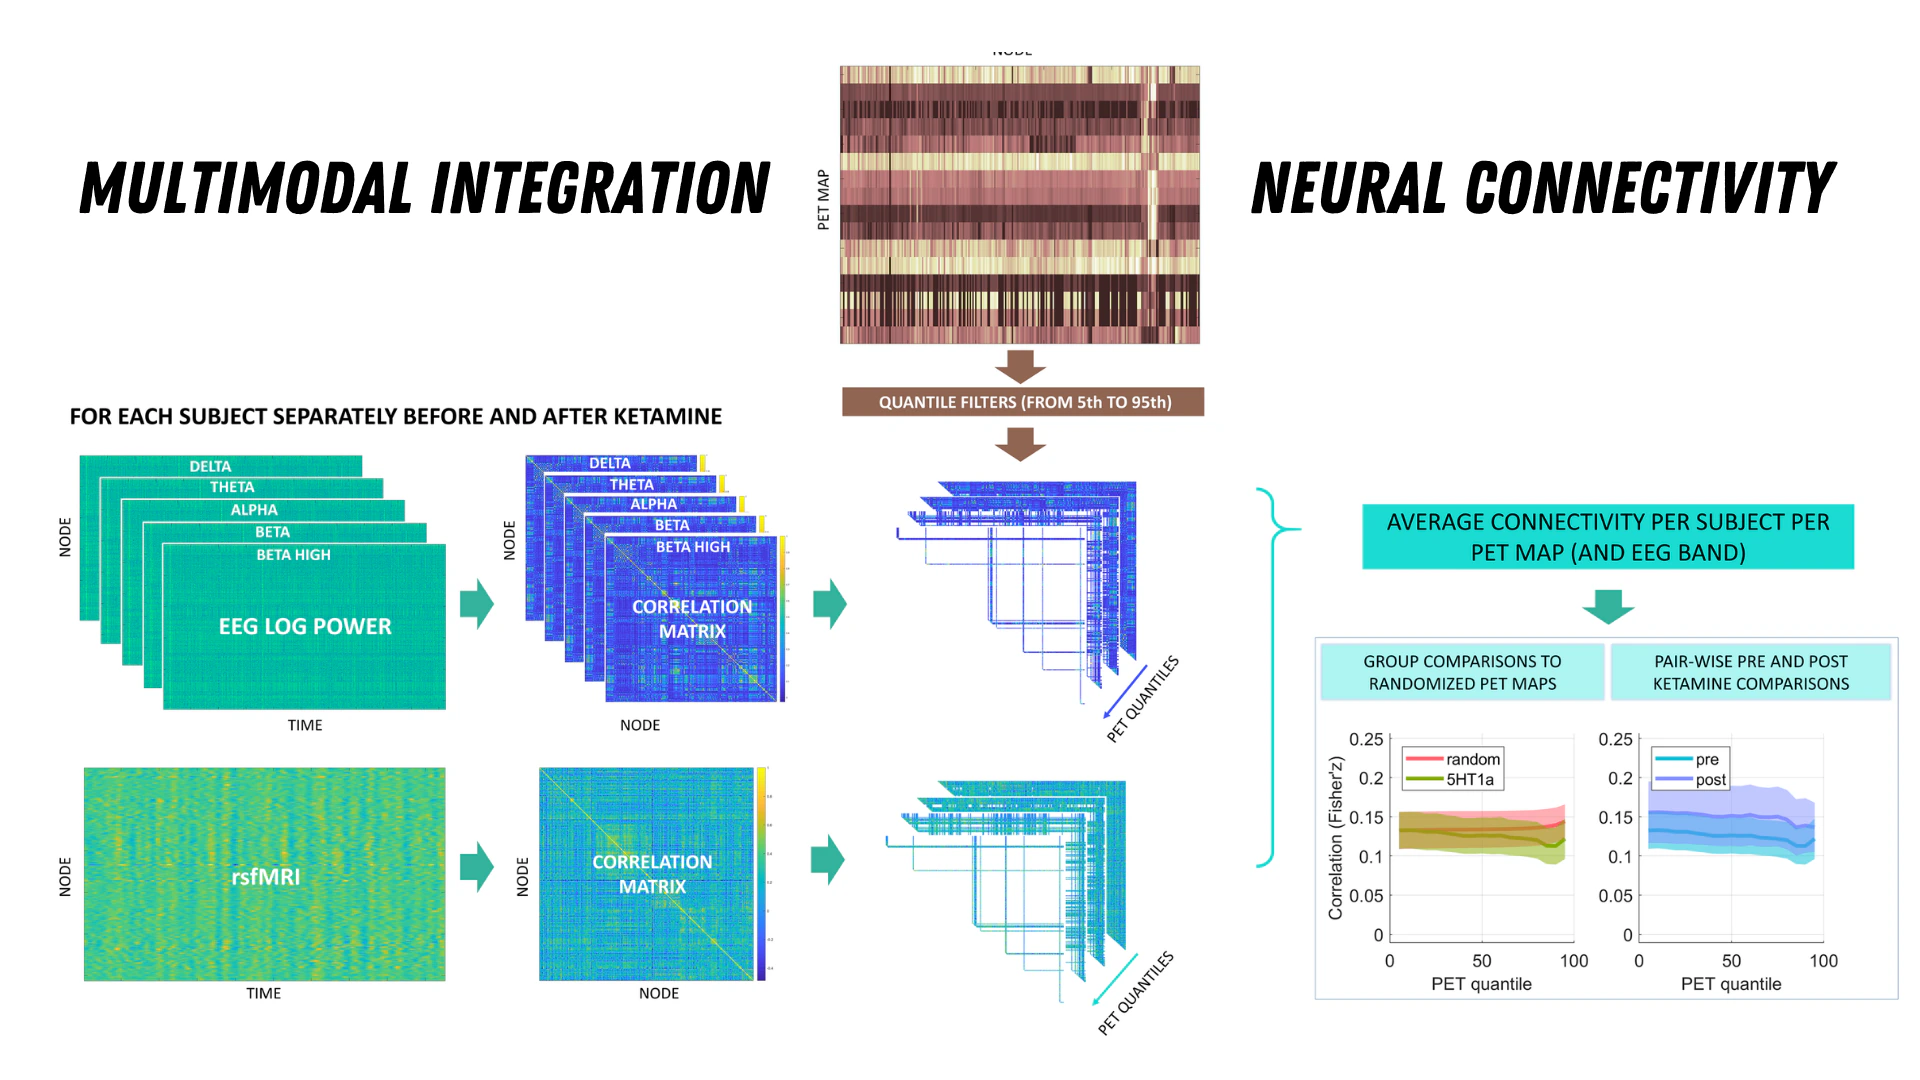
EEG and fMRI measure different physiological processes and operate at very different timescales. To compare them within one analytical framework, I represented both as regional functional-connectivity matrices. For EEG, regional log-power time series were calculated separately for delta, theta, alpha, beta, and high-beta bands before correlations were computed between brain regions. Regional resting-state BOLD time series were similarly correlated to produce rsfMRI connectivity matrices.
PET maps as molecular filters
The PET data were normative spatial atlases describing the regional distribution of neurotransmitter receptors and transporters rather than PET measurements acquired from the same participants. Each map provided a different molecular lens through which to inspect the connectome, including serotonergic, dopaminergic, GABAergic, cholinergic, opioid, cannabinoid, and glutamatergic systems.
Filtering connectivity across molecular quantiles
For each PET map, brain regions were progressively selected across spatial quantiles, approximately from the 5th to the 95th percentile of receptor or transporter availability. At every threshold, connectivity was summarized within the selected molecularly enriched subnetwork. This produced a connectivity curve showing how network synchronization changed as the PET-based selection became increasingly restrictive.
Controlling for arbitrary spatial structure
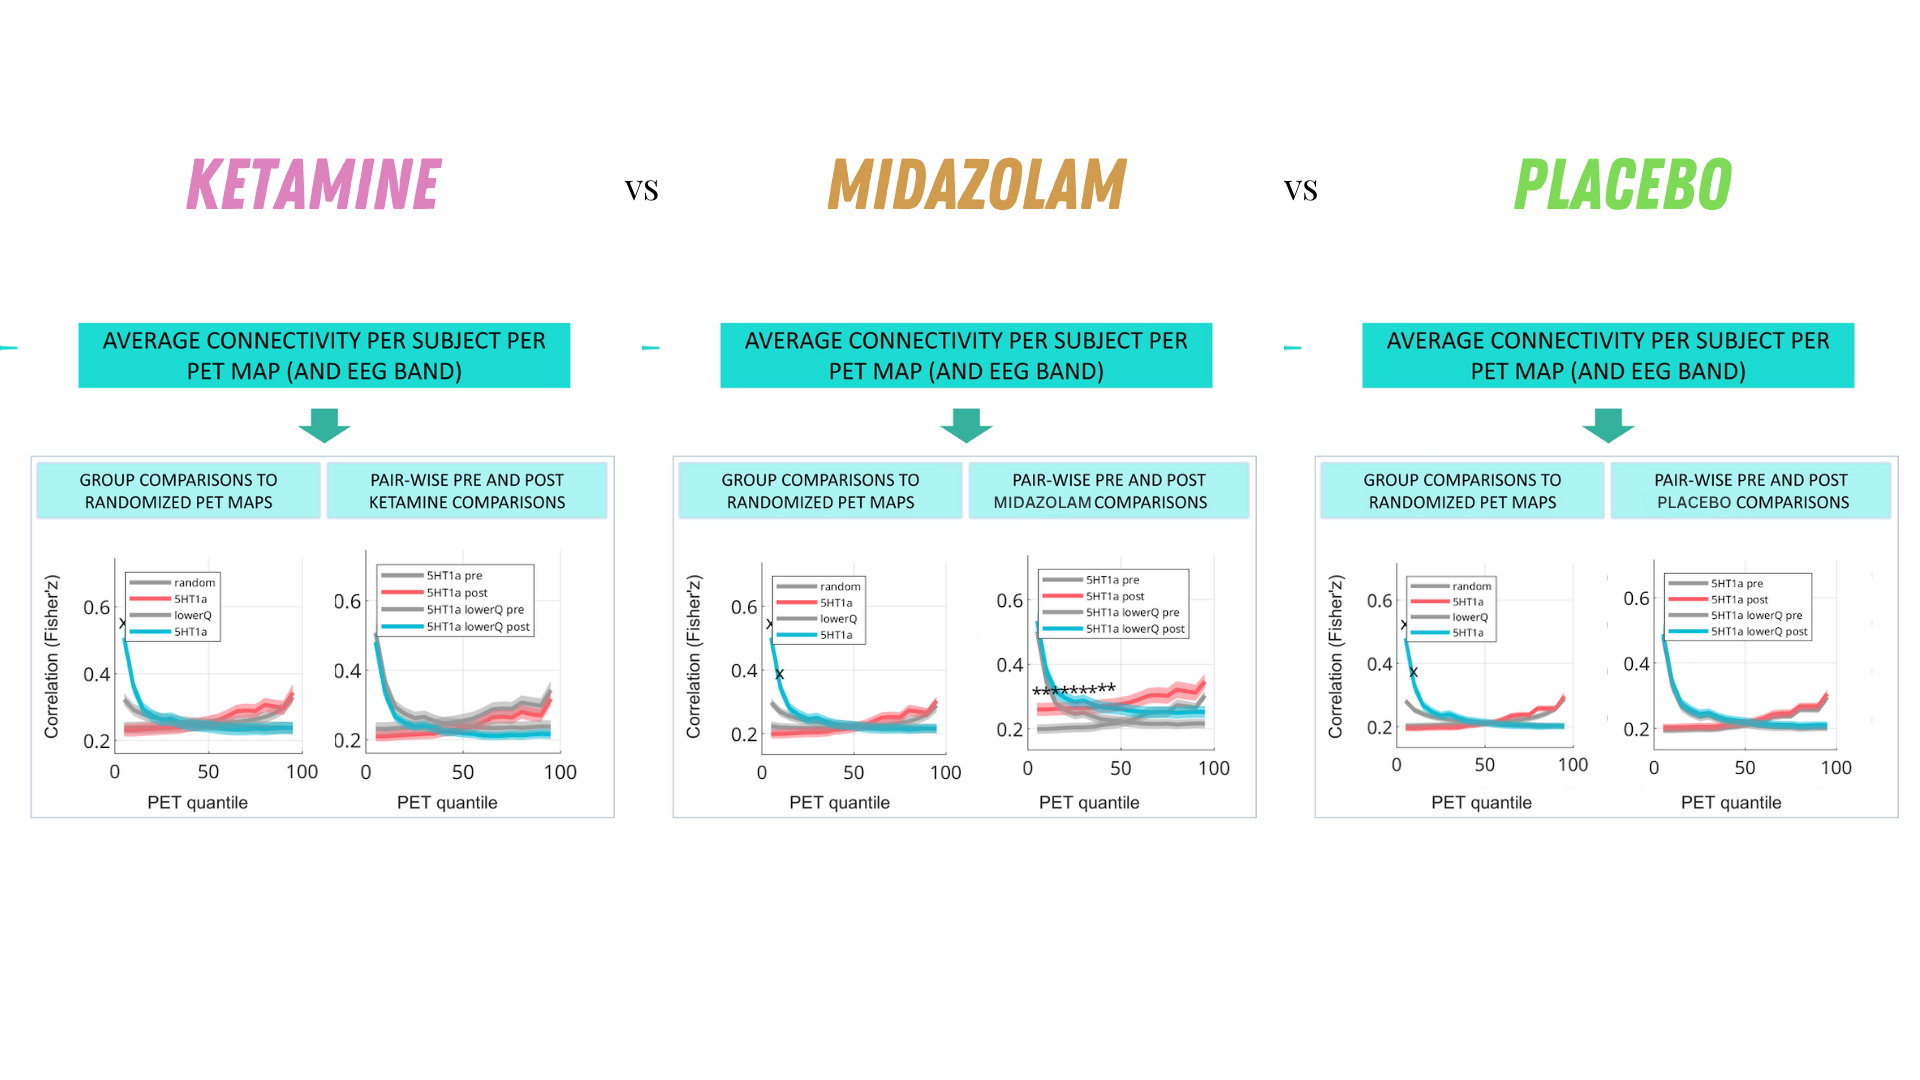
A smooth PET map can correlate with brain connectivity simply because both follow broad anatomical gradients. I therefore compared the biologically meaningful PET-informed results against randomized PET-map controls. This tested whether the observed connectivity profile depended on the actual spatial organization of a neurotransmitter system rather than on an arbitrary regional arrangement.
From thousands of connections to interpretable curves
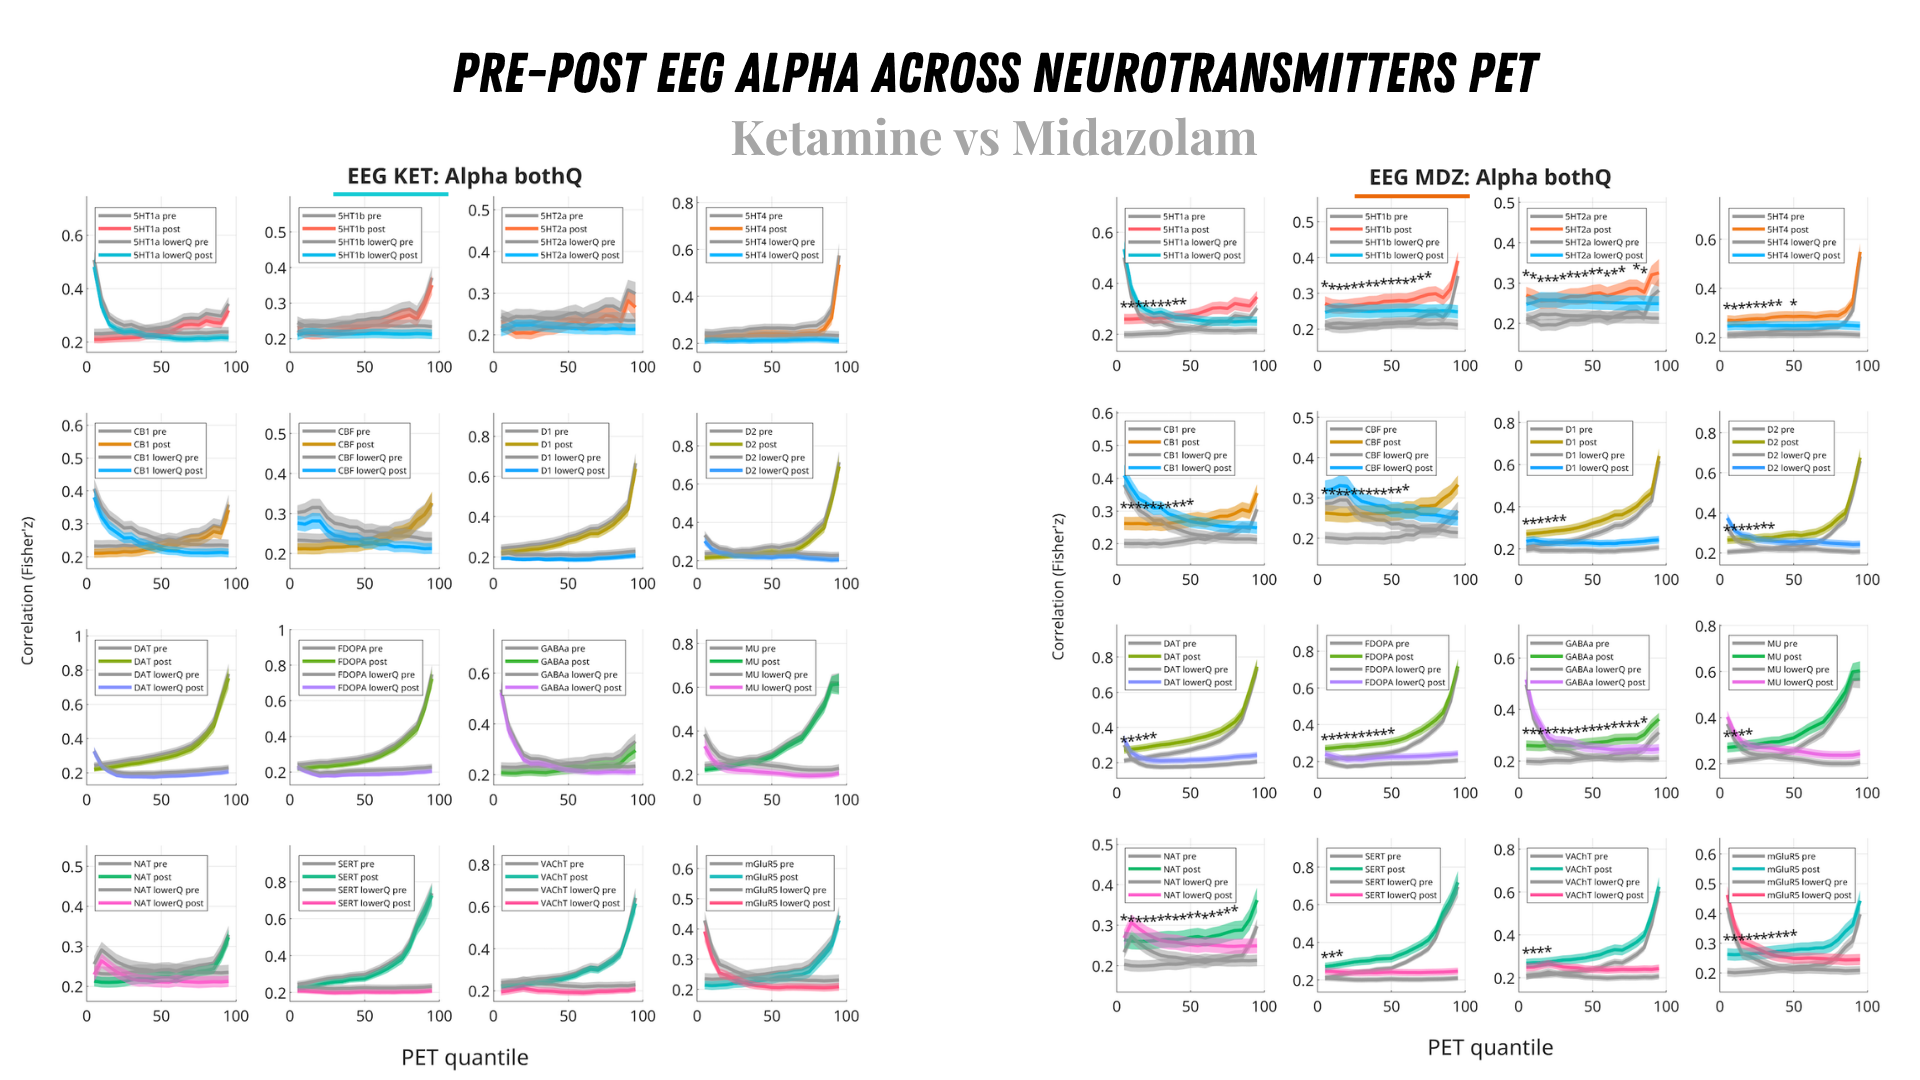
The pipeline reduced high-dimensional connectivity matrices into subject-level profiles indexed by PET quantile. Each profile retained information about participant, drug condition, pre–post state, imaging modality, EEG frequency band where relevant, neurotransmitter map, and quantile. This made it possible to compare molecularly informed network organization across multiple experimental dimensions without interpreting every individual connection separately.
The statistical model
The exploratory analysis used linear mixed-effects modelling with connectivity as the outcome and predictors for drug group, imaging modality, neurotransmitter map, PET quantile, and the interaction between drug group and quantile. A participant-level random intercept accounted for the repeated measurements contributed by each person across conditions, maps, frequency bands, and thresholds.
What the rotation results meant
The rotation presentation showed that connectivity profiles varied strongly across imaging modalities, neurotransmitter maps, PET quantiles, and pharmacological conditions. The exploratory plots also indicated that ketamine and midazolam could produce distinct pre–post patterns. However, these rotation-stage analyses were preliminary and should not be treated as the final inferential results of the later NEOFC publication.
From the case study to NEOFC
The broader coauthored study formalized the underlying principle as the Neurobiological Organization of Functional Connectivity, or NEOFC: a framework for quantifying how functional connectomes relate to spatial neurobiological atlases such as PET receptor maps or gene-expression maps. The final work expanded beyond my original MATLAB case study, incorporated larger datasets and additional modalities, and developed a reusable computational implementation.
What I should remember about my contribution
My contribution was the implementation of an early end-to-end pharmacological analysis pipeline. I did not merely run a prepared statistical model. I connected multimodal inputs, constructed EEG and fMRI connectomes, translated PET atlases into quantile-based network filters, implemented spatial controls, generated interpretable subject-level outputs, and supported the evaluation of drug-related changes. The core engineering task was converting a cross-scale neuroscientific hypothesis into an executable and inspectable MATLAB workflow.
Why this experience remains relevant
This project sits directly at the intersection of computational neuroscience, neuropharmacology, multimodal data integration, and biomarker development. It demonstrates experience with high-dimensional physiological data, molecular brain atlases, repeated-measures experimental designs, spatial control analyses, and the translation of exploratory research code into a contribution to a large collaborative publication.
Primary outputs
Publication, code, and case study
Coauthored NEOFC PaperLinking human brain functional connectivity to underlying neurotransmission · Full-text research articleRead ↗︎PhD Rotation Case StudyMy original presentation documenting the MATLAB pipeline, pharmacological design, exploratory analyses, and initial resultsView ↗︎NEOFC Code and DataOfficial reproducibility repository accompanying the broader collaborative studyView ↗︎
Featured in
Coverage
NEOFC Research RecordForschungszentrum Jülich publication record listing the complete author team and open-access manuscriptView ↗︎Max Planck Publication RecordInstitutional record for the coauthored study and its associated research outputView ↗︎NEOFC Research ArchiveArchived code and shareable research data associated with the published frameworkExplore ↗︎
Continue Exploring
Explore the wider body of work.
Further projects span physiological computing, computational neuroscience, embodied systems, and interdisciplinary engineering.